

Question: If f is the function whose graph is shown in Figure 2 and g(x) = 0 x f(t) dt, find the values of g(0),
If f is the function whose graph is shown in Figure 2 and g(x) = ∫0x f(t) dt, find the values of g(0), g(1), g(2), g(3), g(4), and g(5). Then sketch a rough graph of g.
Figure 2
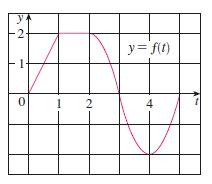
y -2. 1 0 1 2 y = f(t) 4
Step by Step Solution
★★★★★
3.25 Rating (143 Votes )
There are 3 Steps involved in it
1 Expert Approved Answer
Step: 1 Unlock

First we notice that g0 0 0 ft dt 0 From Figure 3 we ... View full answer
Question Has Been Solved by an Expert!
Get step-by-step solutions from verified subject matter experts
Step: 2 Unlock
Step: 3 Unlock