

The table gives the midyear population of Spain, in thousands, from 1955 to 2000. Use a graphing
Question:
The table gives the midyear population of Spain, in thousands, from 1955 to 2000.
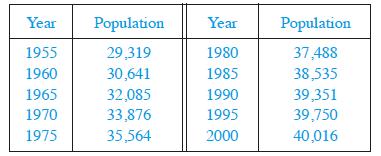 Use a graphing calculator to fit both an exponential function and a logistic function to these data. Graph the data points and both functions, and comment on the accuracy of the models. [Subtract 29,000 from each of the population figures. Then, after obtaining a model from your calculator, add 29,000 to get your final model. It might be helpful to choose to correspond to 1955 or 1975.]
Step by Step Answer:

This question has not been answered yet.
You can Ask your question!
Related Book For 

Question Posted:
