

a. Calculate and graph the hydrogen radial wave function R 2p (r) over the interval 0
Question:
a. Calculate and graph the hydrogen radial wave function R2p(r) over the interval 0 ≤ r ≤ 8aB.
b. Determine the value of r (in terms of aB) for which R2p(r) is a maximum.
c. Example 41.3 and Figure 41.8 showed that the radial probability density for the 2p state is a maximum at r = 4aB. Explain why this differs from your answer to part b.
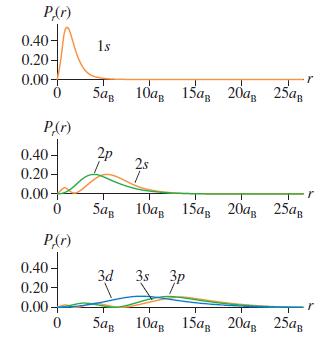
Figure 41.8
Fantastic news! We've Found the answer you've been seeking!
Step by Step Answer:
Solve a From Equation 417 the 2p radial wave function is The graph of R 2p r is seen to have a singl...View the full answer

Answered By
Muhammad Haroon
More than 3 years experience in teaching undergraduate and graduate level courses which includes Object Oriented Programming, Data Structures, Algorithms, Database Systems, Theory of Automata, Theory of Computation, Database Administration, Web Technologies etc.
3+ Reviews
10+ Question Solved
Related Book For 
Physics For Scientists And Engineers A Strategic Approach With Modern Physics
ISBN: 9780321740908
3rd Edition
Authors: Randall D. Knight
Question Posted:
