

A graph of a population of yeast cells in a new laboratory culture as a function of
Question:
A graph of a population of yeast cells in a new laboratory culture as a function of time is shown.
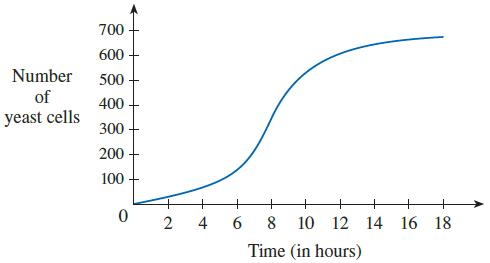
(a) Describe how the rate of population increase varies.
(b) When is this rate highest?
(c) On what intervals is the population function concave upward or downward?
(d) Estimate the coordinates of the inflection point.
Fantastic news! We've Found the answer you've been seeking!
Step by Step Answer:
a The rate of increase of the population is initially very small then gets larger ...View the full answer

Answered By
Muhammad Umair
I have done job as Embedded System Engineer for just four months but after it i have decided to open my own lab and to work on projects that i can launch my own product in market. I work on different softwares like Proteus, Mikroc to program Embedded Systems. My basic work is on Embedded Systems. I have skills in Autocad, Proteus, C++, C programming and i love to share these skills to other to enhance my knowledge too.
1+ Reviews
10+ Question Solved
Related Book For 

Calculus Early Transcendentals
ISBN: 9781337613927
9th Edition
Authors: James Stewart, Daniel K. Clegg, Saleem Watson, Lothar Redlin
Question Posted:
