

The figure shows the graph of the derivative f' of a function f. (a) On what intervals
Question:
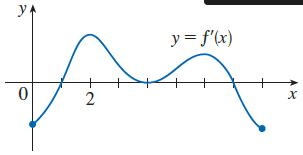
The figure shows the graph of the derivative f' of a function f.
(a) On what intervals is f increasing or decreasing?
(b) For what values of x does f have a local maximum or minimum?
(c) Sketch the graph of f".
(d) Sketch a possible graph of f.
Fantastic news! We've Found the answer you've been seeking!
Step by Step Answer:
a Since f 0 on 1 4 and 4 7 f is increasing on these intervals Since f 0 on 0 1 and 7 ...View the full answer

Answered By
ANDREW KIPRUTO
Academic Writing Expert
I have over 7 years of research and application experience. I am trained and licensed to provide expertise in IT information, computer sciences related topics and other units like chemistry, Business, law, biology, biochemistry, and genetics. I'm a network and IT admin with +8 years of experience in all kind of environments.
I can help you in the following areas:
Networking
- Ethernet, Wireless Airmax and 802.11, fiber networks on GPON/GEPON and WDM
- Protocols and IP Services: VLANs, LACP, ACLs, VPNs, OSPF, BGP, RADIUS, PPPoE, DNS, Proxies, SNMP
- Vendors: MikroTik, Ubiquiti, Cisco, Juniper, HP, Dell, DrayTek, SMC, Zyxel, Furukawa Electric, and many more
- Monitoring Systems: PRTG, Zabbix, Whatsup Gold, TheDude, RRDtoo
Always available for new projects! Contact me for any inquiries
1+ Reviews
10+ Question Solved
Related Book For 

Calculus Early Transcendentals
ISBN: 9781337613927
9th Edition
Authors: James Stewart, Daniel K. Clegg, Saleem Watson, Lothar Redlin
Question Posted:
