

The graph of a cars acceleration a(t), measured in ft/s 2 , is shown. Use the Midpoint
Question:
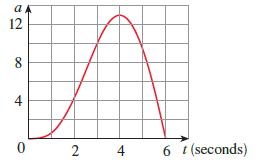
The graph of a car’s acceleration a(t), measured in ft/s2, is shown. Use the Midpoint Rule to estimate the increase in the velocity of the car during the six-second time interval.
Fantastic news! We've Found the answer you've been seeking!
Step by Step Answer:
To use the Midpoint Rule w...View the full answer

Answered By
John Aketch
I have a 10 years tutoring experience and I have helped thousands of students to accomplish their educational endeavors globally. What interests me most is when I see my students being succeeding in their classwork. I am confident that I will bring a great change to thins organization if granted the opportunity. Thanks
8+ Reviews
18+ Question Solved
Related Book For 

Calculus Early Transcendentals
ISBN: 9781337613927
9th Edition
Authors: James Stewart, Daniel K. Clegg, Saleem Watson, Lothar Redlin
Question Posted:
