

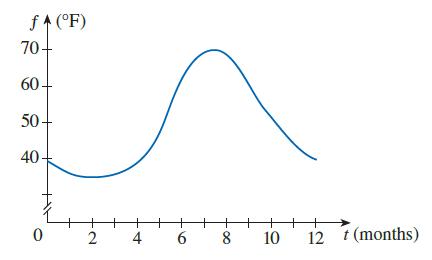
The graph shows how the average surface water temperature f of Lake Michigan varies over the course
Question:
The graph shows how the average surface water temperature f of Lake Michigan varies over the course of a year (where t is measured in months with t = 0 corresponding to January 1). The average was calculated from data obtained over a 20-year period ending in 2011. Sketch the graph of the derivative function f'. When is f'(t) largest?
Fantastic news! We've Found the answer you've been seeking!
Step by Step Answer:
It appears that there are horizontal tangents on the graph of f for ...View the full answer

Answered By
Rukhsar Ansari
I am professional Chartered accountant and hold Master degree in commerce. Number crunching is my favorite thing. I have teaching experience of various subjects both online and offline. I am online tutor on various online platform.
4+ Reviews
17+ Question Solved
Related Book For 

Calculus Early Transcendentals
ISBN: 9781337613927
9th Edition
Authors: James Stewart, Daniel K. Clegg, Saleem Watson, Lothar Redlin
Question Posted:
