

A typical population curve is shown in the figure. The population is small at t = 0
Question:
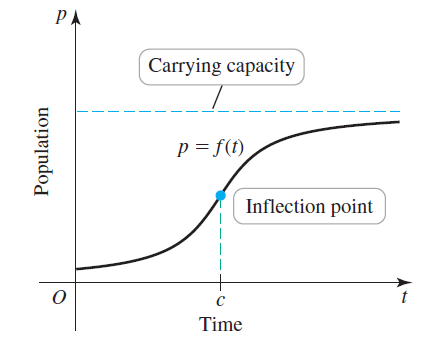
A typical population curve is shown in the figure. The population is small at t = 0 and increases toward a steady-state level called the carrying capacity. Explain why the maximum growth rate occurs at an inflection point of the population curve.
Fantastic news! We've Found the answer you've been seeking!
Step by Step Answer:
The growth rate is given by the slope of the tangent line to ...View the full answer

Answered By
Pushpinder Singh
Currently, I am PhD scholar with Indian Statistical problem, working in applied statistics and real life data problems. I have done several projects in Statistics especially Time Series data analysis, Regression Techniques.
I am Master in Statistics from Indian Institute of Technology, Kanpur.
I have been teaching students for various University entrance exams and passing grades in Graduation and Post-Graduation.I have expertise in solving problems in Statistics for more than 2 years now.I am a subject expert in Statistics with Assignmentpedia.com.
3+ Reviews
10+ Question Solved
Related Book For 

Calculus Early Transcendentals
ISBN: 978-0321947345
2nd edition
Authors: William L. Briggs, Lyle Cochran, Bernard Gillett
Question Posted:
