

The figure shows the rate at which U.S. oil was produced and imported between 1920 and 2005
Question:
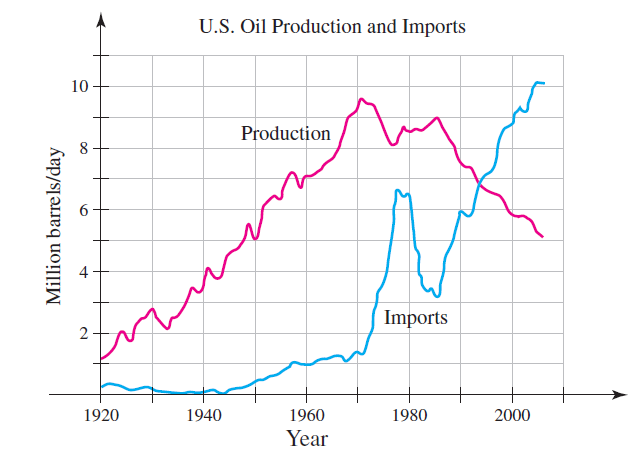
The figure shows the rate at which U.S. oil was produced and imported between 1920 and 2005 in units of millions of barrels per day. The total amount of oil produced or imported is given by the area of the region under the corresponding curve. Be careful with units because both days and years are used in this data set.
a. Use numerical integration to estimate the amount of U.S. oil produced between 1940 and 2000. Use the method of your choice and experiment with values of n.
b. Use numerical integration to estimate the amount of oil imported between 1940 and 2000. Use the method of your choice and experiment with values of n.
Fantastic news! We've Found the answer you've been seeking!
Step by Step Answer:
a For even n we have Sn 20 365 a 4x 4x4In1 fb ...View the full answer

Answered By
Mugdha Sisodiya
My self Mugdha Sisodiya from Chhattisgarh India. I have completed my Bachelors degree in 2015 and My Master in Commerce degree in 2016. I am having expertise in Management, Cost and Finance Accounts. Further I have completed my Chartered Accountant and working as a Professional.
Since 2012 I am providing home tutions.
2+ Reviews
10+ Question Solved
Related Book For 

Calculus Early Transcendentals
ISBN: 978-0321947345
2nd edition
Authors: William L. Briggs, Lyle Cochran, Bernard Gillett
Question Posted:
