

The population of a culture of cells after t days is approximated by the function a. Graph
Question:
The population of a culture of cells after t days is approximated by the function 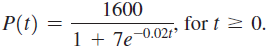
a. Graph the population function.
b. What is the average growth rate during the first 10 days?
c. Looking at the graph, when does the growth rate appear to be a maximum?
d. Differentiate the population function to determine the growth rate function P'(t).
e. Graph the growth rate. When is it a maximum and what is the population at the time that the growth rate is a maximum?
Fantastic news! We've Found the answer you've been seeking!
Step by Step Answer:
a b The average growth rate for the first ten days is cells per day c The maximu...View the full answer

Answered By
Collins Omondi
I have been an academic and content writer for at least 6 years, working on different academic fields including accounting, political science, technology, law, and nursing in addition to those earlier listed under my education background.
I have a Bachelor’s degree in Commerce (Accounting option), and vast knowledge in various academic fields Finance, Economics, Marketing, Management, Social Science, Women and Gender, Business law, and Statistics among others.
4+ Reviews
16+ Question Solved
Related Book For 

Calculus Early Transcendentals
ISBN: 978-0321947345
2nd edition
Authors: William L. Briggs, Lyle Cochran, Bernard Gillett
Question Posted:
