

Question: Use a graphing utility to graph the hyperbolas for e = 1.1, 1.3, 1.5, 1.7, and 2 on the same set of axes. Explain how
Use a graphing utility to graph the hyperbolas 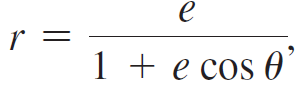 for e = 1.1, 1.3, 1.5, 1.7, and 2 on the same set of axes. Explain how the shapes of the curves vary as e changes.
1 +os
Step by Step Solution
★★★★★
3.40 Rating (163 Votes )
There are 3 Steps involved in it
1 Expert Approved Answer
Step: 1 Unlock

As e gets la... View full answer
Question Has Been Solved by an Expert!
Get step-by-step solutions from verified subject matter experts
Step: 2 Unlock
Step: 3 Unlock