

Use the graph of f in the figure to determine the values of x in the interval
Question:
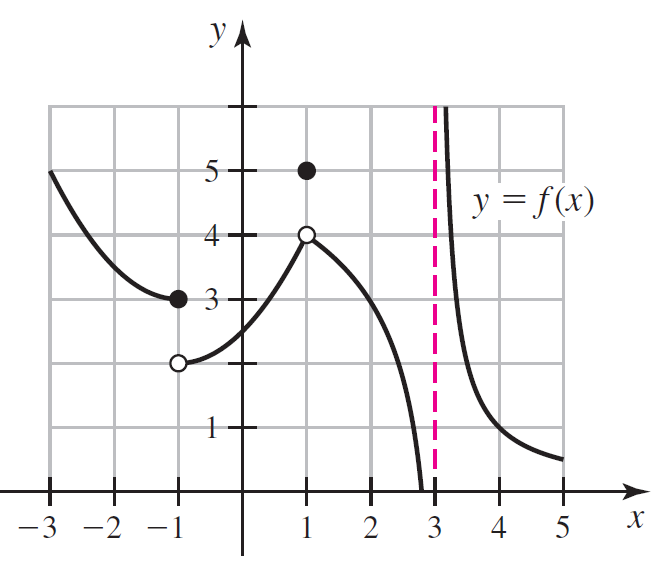
Use the graph of f in the figure to determine the values of x in the interval (-3, 5) at which f fails to be continuous. Justify your answers using the continuity checklist.
Fantastic news! We've Found the answer you've been seeking!
Step by Step Answer:
This function is discontinuous at x 1 at x 1 an...View the full answer

Answered By
OTIENO OBADO
I have a vast experience in teaching, mentoring and tutoring. I handle student concerns diligently and my academic background is undeniably aesthetic
3+ Reviews
10+ Question Solved
Related Book For 

Calculus Early Transcendentals
ISBN: 978-0321947345
2nd edition
Authors: William L. Briggs, Lyle Cochran, Bernard Gillett
Question Posted:
