

Question: A musical note like that produced with a tuning fork or pitch meter is a pressure wave. Table 1.19 gives frequencies (in Hz) of musical
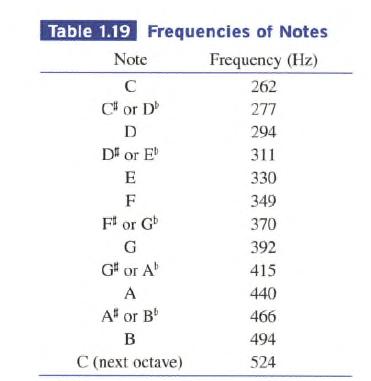
A musical note like that produced with a tuning fork or pitch meter is a pressure wave. Table 1.19 gives frequencies (in Hz) of musical notes on the tempered scale. The pressure versus time tuning fork data in Table 1.20 were collected using a CBL™ and a microphone.
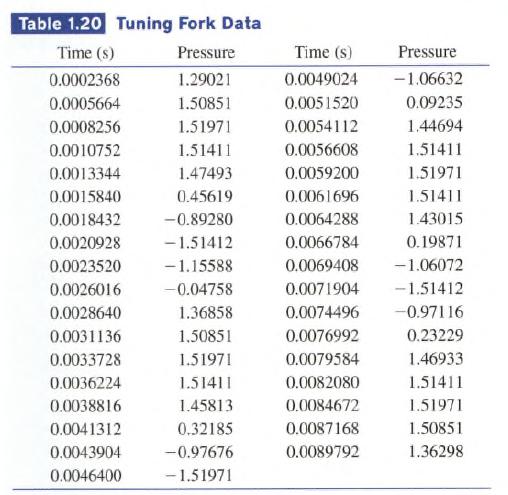
(a) Find a sinusoidal regression equation for the data in Table 1.20 and superimpose its graph on a scatter plot of the data.
(b) Determine the frequency of and identify the musical note produced by the tuning fork.
Table 1.19 Frequencies of Notes Note Frequency (Hz) C 262 C# or Db 277 D 294 D# or Eb 311 E 330 F 349 For Gb 370 G 392 G# or Ab 415 A 440 A or Bb 466 B 494 C (next octave) 524
Step by Step Solution
3.44 Rating (170 Votes )
There are 3 Steps involved in it
Given To locate the aforementioned items as equation and th... View full answer

Get step-by-step solutions from verified subject matter experts