

Table 1.11 gives the population of Texas for several years. (a) Let x = 0 represent 1980,
Question:
Table 1.11 gives the population of Texas for several years.
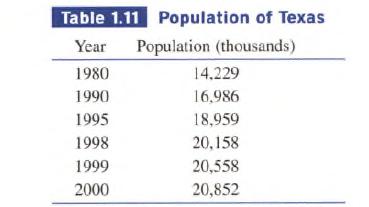
(a) Let x = 0 represent 1980, x = 1 represent 1981, and so forth. Find an exponential regression for the data, and superimpose its graph on a scatter plot of the data.
(b) Use the exponential regression equation to estimate the population of Texas in 2003. How close is the estimate to the actual population of 22.119,000 in 2003?
(c) Use the exponential regression equation to estimate the annual
rate of growth of the population of Texas.
Fantastic news! We've Found the answer you've been seeking!
Step by Step Answer:
a The exponential regression equation can be found by taking the natu...View the full answer

Answered By
Dansteve Matoke
As a consequence of more than three years of experience in ACADEMIC WRITING, I have vast, diverse knowledge and impeccable grammar. I guarantee the quality of my work across multiple fields. I intend to precisely meet the clients' expectations. Let's work together to achieve exceptional grades.
0 Reviews
10+ Question Solved
Related Book For 

Calculus Graphical, Numerical, Algebraic
ISBN: 9780132014083
3rd Edition
Authors: Ross L. Finney, Franklin D. Demana, Bert K. Waits, Daniel Kennedy
Question Posted:
