

Question: Each graph below gives the cost as a function of production level. Use the method of graphical optimization to estimate the production level that results
Each graph below gives the cost as a function of production level. Use the method of graphical optimization to estimate the production level that results in the minimum cost per item produced.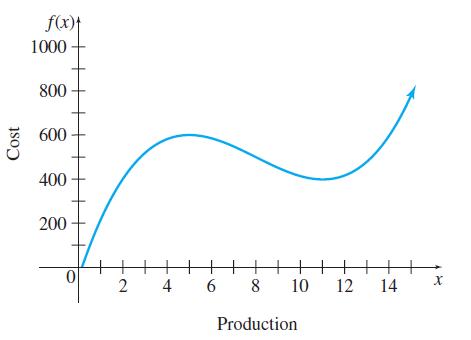
Cost f(x)+ 1000 800 600 400 200 0 2 4 ||||||||| 10 6 8 Production 12 14 X
Step by Step Solution
★★★★★
3.41 Rating (154 Votes )
There are 3 Steps involved in it
1 Expert Approved Answer
Step: 1 Unlock

The value x 115 minimizes fxx because ... View full answer
Question Has Been Solved by an Expert!
Get step-by-step solutions from verified subject matter experts
Step: 2 Unlock
Step: 3 Unlock