

Exercises refer to the Laffer curve, originated by the economist Arthur Laffer. An idealized version of this
Question:
Exercises refer to the Laffer curve, originated by the economist Arthur Laffer. An idealized version of this curve is shown here. According to this curve, decreasing a tax rate, say from x2 percent to x1 percent on the graph, can actually lead to an increase in government revenue. The theory is that people will work harder and earn more money if they are taxed at a lower rate, so the government ends up with more revenue than it would at a higher tax rate. All economists agree on the endpoints—0 revenue at tax rates of both 0% and 100%—but there is much disagreement on the location of the tax rate x1 that produces the maximum revenue.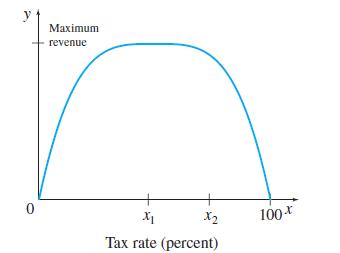
A function that might describe the entire Laffer curve is y = x(100 - x)(x2 + 500), where y is government revenue in hundreds of thousands of dollars from a tax rate of x percent, with the function valid for 0 ≤ x ≤ 100. Find the revenue from the following tax rates.
(a) 10%
(b) 40%
(c) 50%
(d) 80%
(e) Graph the function.
Step by Step Answer:
a x10 y 10100 1010 2 500 1090600 54 billion b x 40 ...View the full answer


