

Question: In Exercise 60, Section 2.3, you were given a function to model the production of blood cells. Such models are useful in the study of
In Exercise 60, Section 2.3, you were given a function to model the production of blood cells. Such models are useful in the study of leukemia and other so-called dynamical diseases in which certain physiological systems begin to behave erratically. An alternative model* for blood cell production developed by A. Lasota involves the exponential production function
![]()
where A, s, and r are positive constants and x is the number of granulocytes (a type of white blood cell) present.
a. Find the blood cell level x that maximizes the production function p(x). How do you know the optimum level is a maximum?
b. If s > 1, show that the graph of p(x) has two inflection points. Sketch the graph. Give a physical interpretation of the inflection points.
c. Sketch the graph of p(x) in the case where 0 ≤ s ≤ 1. What is different in this case?
Data from Exercises 60 section 2.3
A biological model† measures the production of a certain type of white blood cell (granulocytes) by the function
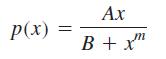
where A and B are positive constants, the exponent m is positive, and x is the number of cells present.
P(x) = Ax'e-sx/r
Step by Step Solution
3.32 Rating (161 Votes )
There are 3 Steps involved in it
a Since the domain of p is p 0 this means the absolute maximum occurs whe... View full answer

Get step-by-step solutions from verified subject matter experts