

Question: In Exercises, estimate the area under each curve by summing the area of rectangles. Use the left endpoints, then the right endpoints, and then give
In Exercises, estimate the area under each curve by summing the area of rectangles. Use the left endpoints, then the right endpoints, and then give the average of those answers.
The following graph shows the rate of use of electrical energy (in millions of kilowatts) in a certain city on a very hot day. Estimate the total usage of electricity on that day. Let the width of each rectangle be 2 hours.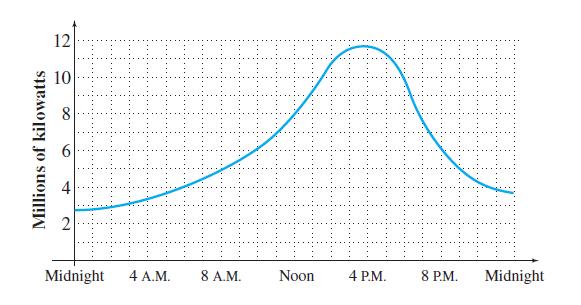
Millions of kilowatts 12 10 8 6 4 2 Midnight 4 A.M. 8 A.M. Noon 4 P.M. 8 P.M. Midnight
Step by Step Solution
3.45 Rating (155 Votes )
There are 3 Steps involved in it
Left endpoints Read values of the function from the graph ... View full answer

Get step-by-step solutions from verified subject matter experts