

Question: In one research study, the population of a certain shellfish in an area at time t was closely approximated by the following graph. Estimate and
In one research study, the population of a certain shellfish in an area at time t was closely approximated by the following graph. Estimate and interpret the derivative at each of the marked points.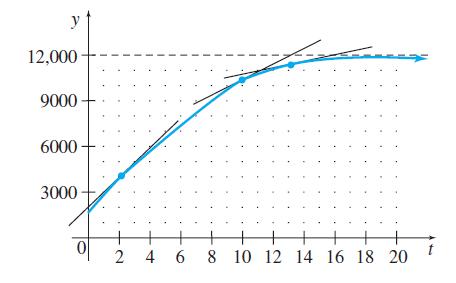
y 12,000 9000 6000 3000 2 4 6 8 10 12 14 16 18 20
Step by Step Solution
★★★★★
3.26 Rating (158 Votes )
There are 3 Steps involved in it
1 Expert Approved Answer
Step: 1 Unlock

The derivative at 2 4000 can be approximated by the slope of the lin... View full answer
Question Has Been Solved by an Expert!
Get step-by-step solutions from verified subject matter experts
Step: 2 Unlock
Step: 3 Unlock