

Question: Let t = 0 correspond to 1790, and let every decade correspond to an increase in t of 1. Use a calculator with logistic regression
Let t = 0 correspond to 1790, and let every decade correspond to an increase in t of 1. Use a calculator with logistic regression capability to complete the following. Use the table from Exercise 66.
(a) Plot the data points. Do the points suggest that a logistic function is appropriate here?
(b) Use the logistic regression function on your calculator to determine the logistic equation that best fits the data.
(c) Plot the logistic equation from part (b) on the same graph as the data points. How well does the logistic equation seem to fit the data?
(d) What seems to be the limiting size of the U.S. population?
Exercise 66.
In the following table of U.S. Census figures, y is the population in millions.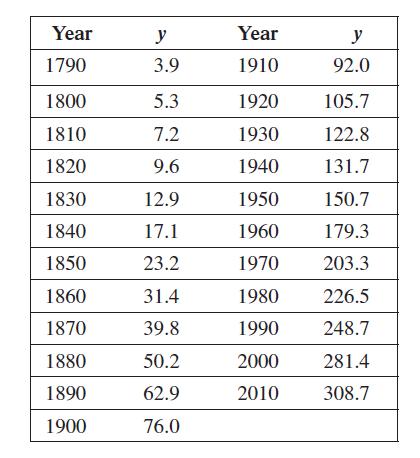
Year 1790 1800 1810 1820 1830 1840 1850 1860 1870 1880 1890 1900 y 3.9 5.3 7.2 9.6 12.9 17.1 23.2 31.4 39.8 50.2 62.9 76.0 Year 1910 1920 1930 1940 1950 1960 1970 1980 1990 2000 2010 y 92.0 105.7 122.8 131.7 150.7 179.3 203.3 226.5 248.7 281.4 308.7
Step by Step Solution
3.47 Rating (163 Votes )
There are 3 Steps involved in it
a The points suggest the lower portion of a logistic growth curve so yes a logistic fu... View full answer

Get step-by-step solutions from verified subject matter experts