

Question: Listed in the table below are the estimated 2018 populations (in millions) and the 2018 salary of the governor (in thousands of dollars) for ten
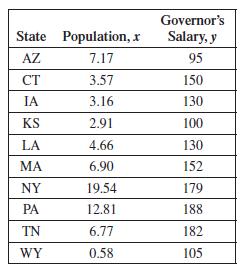
Listed in the table below are the estimated 2018 populations (in millions) and the 2018 salary of the governor (in thousands of dollars) for ten randomly selected states.
(a) Find the correlation coefficient. Do the data seem to fit a straight line?
(b) Draw a scatterplot of the data. Compare this with your answer from part (a).
(c) Find the equation for the least squares line.
(d) Based on your answer to part (c), how much does a governor’s salary increase, on average, for each additional million in population?
State Population, x AZ 7.17 CT IA KS LA NY PA TN WY 3.57 3.16 2.91 4.66 6.90 19.54 12.81 6.77 0.58 Governor's Salary, y 95 150 130 100 130 152 179 188 182 105
Step by Step Solution
3.41 Rating (167 Votes )
There are 3 Steps involved in it
a Using a graphing calculator r 06683 The data seem to f... View full answer

Get step-by-step solutions from verified subject matter experts