

Refer to the graph of blood pressure as a function of time shown in Figure 2.9. Estimate
Question:
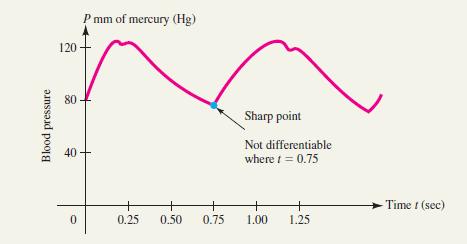
Refer to the graph of blood pressure as a function of time shown in Figure 2.9.
Estimate the average rate of change in blood pressure over the time periods [0.7, 0.75] and [0.75, 0.8]. Interpret your results.
Figure 2.9.
Fantastic news! We've Found the answer you've been seeking!
Step by Step Answer:
If Pt represents the blood pressure function then P07 80 ...View the full answer

Answered By
Somshukla Chakraborty
I have a teaching experience of more than 4 years by now in diverse subjects like History,Geography,Political Science,Sociology,Business Enterprise,Economics,Environmental Management etc.I teach students from classes 9-12 and undergraduate students.I boards I handle are IB,IGCSE, state boards,ICSE, CBSE.I am passionate about teaching.Full satisfaction of the students is my main goal.
I have completed my graduation and master's in history from Jadavpur University Kolkata,India in 2012 and I have completed my B.Ed from the same University in 2013. I have taught in a reputed school of Kolkata (subjects-History,Geography,Civics,Political Science) from 2014-2016.I worked as a guest lecturer of history in a college of Kolkata for 2 years teaching students of 1st ,2nd and 3rd year. I taught Ancient and Modern Indian history there.I have taught in another school in Mohali,Punjab teaching students from classes 9-12.Presently I am working as an online tutor with concept tutors,Bangalore,India(Carve Niche Pvt.Ltd.) for the last 1year and also have been appointed as an online history tutor by Course Hero(California,U.S) and Vidyalai.com(Chennai,India).
2+ Reviews
10+ Question Solved
Related Book For 

Calculus For Business, Economics And The Social And Life Sciences
ISBN: 9780073532387
11th Brief Edition
Authors: Laurence Hoffmann, Gerald Bradley, David Sobecki, Michael Price
Question Posted:
