

The accompanying figure shows the product life cycle graph, with typical products marked on it. It illustrates
Question:
The accompanying figure shows the product life cycle graph, with typical products marked on it. It illustrates the fact that a new product is often purchased at a faster and faster rate as people become familiar with it. In time, saturation is reached and the purchase rate stays constant until the product is made obsolete by newer products, after which it is purchased less and less
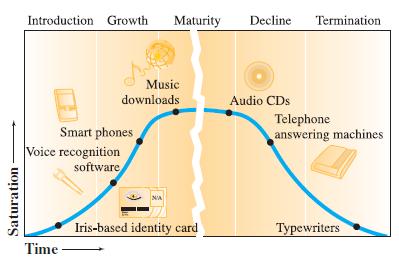
a. Which products on the left side of the graph are closest to the left-hand inflection point? What does the inflection point mean here?
b. Which product on the right side of the graph is closest to the right-hand inflection point? What does the inflection point mean here?
c. Discuss where portable Blu-ray players, iPads, and other new technologies should be placed on the graph.
Step by Step Answer:
a The products closest to the lefthand inflection point are Music downloads Smartphones and Voice re...View the full answer


Calculus With Applications
ISBN: 9780321831101
10th Edition
Authors: Margaret L Lial, Raymond N Greenwell, Nathan P Ritchey
