

Question: The accompanying graph represents a function g(x) that oscillates more and more frequently as x approaches 0 from either the right or the left but
The accompanying graph represents a function g(x) that oscillates more and more frequently as x approaches 0 from either the right or the left but with decreasing magnitude. Does
![]()
exist? If so, what is its value?
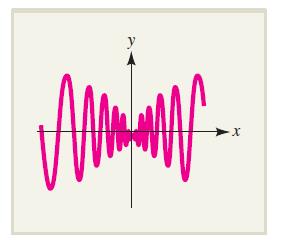
lim g(x) x-0
Step by Step Solution
★★★★★
3.60 Rating (168 Votes )
There are 3 Steps involved in it
1 Expert Approved Answer
Step: 1 Unlock

This limit does exist The curve is bounded by the lines ... View full answer
Question Has Been Solved by an Expert!
Get step-by-step solutions from verified subject matter experts
Step: 2 Unlock
Step: 3 Unlock