

The accompanying graph shows how the volume of lumber V in a tree varies with time t
Question:
The accompanying graph shows how the volume of lumber V in a tree varies with time t (the age of the tree). Use the graph to estimate the rate at which V is changing with respect to time when t = 30 years. What seems to be happening to the rate of change of V as t increases without bound (that is, in the long run)?
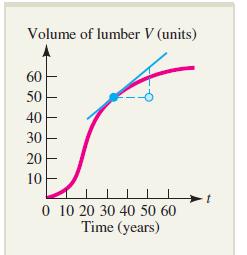
Graph showing how the volume of lumber V in a tree varies with time t.
Fantastic news! We've Found the answer you've been seeking!
Step by Step Answer:
When In the long run the rate ...View the full answer

Answered By
PALASH JHANWAR
I am a Chartered Accountant with AIR 45 in CA - IPCC. I am a Merit Holder ( B.Com ). The following is my educational details.
PLEASE ACCESS MY RESUME FROM THE FOLLOWING LINK: https://drive.google.com/file/d/1hYR1uch-ff6MRC_cDB07K6VqY9kQ3SFL/view?usp=sharing
3+ Reviews
10+ Question Solved
Related Book For 

Calculus For Business, Economics And The Social And Life Sciences
ISBN: 9780073532387
11th Brief Edition
Authors: Laurence Hoffmann, Gerald Bradley, David Sobecki, Michael Price
Question Posted:
