

The accompanying graph shows the number of units in inventory at a certain business over a 2-year
Question:
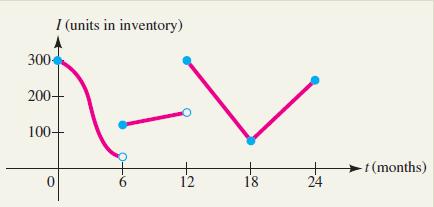
The accompanying graph shows the number of units in inventory at a certain business over a 2-year period. When is the graph discontinuous? What do you think is happening at those times?
Fantastic news! We've Found the answer you've been seeking!
Step by Step Answer:
Based on the given graph a it is discontinuous at t 6 and ...View the full answer

Answered By
Gloria Joseph
Hi,
I am a tutor in Mathematics subject. I love learning and teaching too. I understand that each student is unique and hence I need to change myself - while communicating with each one of the students - so as to make the activity of learning a play thing, once and then for ever!
I believe in activity-based learning, with the help of tools/games/students participating in events- especially outdoor ones. I also believe in continuous learning and teaching to keep myself up to date!
Cheers!!
0 Reviews
10+ Question Solved
Related Book For 

Calculus For Business, Economics And The Social And Life Sciences
ISBN: 9780073532387
11th Brief Edition
Authors: Laurence Hoffmann, Gerald Bradley, David Sobecki, Michael Price
Question Posted:
