

The accompanying table gives the personal consumption expenditure and the corresponding disposable income (in billions of dollars)
Question:
The accompanying table gives the personal consumption expenditure and the corresponding disposable income (in billions of dollars) for the United States in the period 2003–2008:
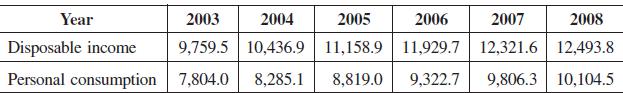
a. Plot these data on a graph, with disposable income on the x axis and consumption expenditure on the y axis.
b. Find the equation of the least-squares line for the data.
c. Use the least-squares line to predict the consumption that would correspond to $13 trillion ($13,000 billion) of disposable income.
Fantastic news! We've Found the answer you've been seeking!
Step by Step Answer:
a b For this data n 6 and where x represents disposable in...View the full answer

Answered By
Muhammad Umair
I have done job as Embedded System Engineer for just four months but after it i have decided to open my own lab and to work on projects that i can launch my own product in market. I work on different softwares like Proteus, Mikroc to program Embedded Systems. My basic work is on Embedded Systems. I have skills in Autocad, Proteus, C++, C programming and i love to share these skills to other to enhance my knowledge too.
1+ Reviews
10+ Question Solved
Related Book For 

Calculus For Business, Economics And The Social And Life Sciences
ISBN: 9780073532387
11th Brief Edition
Authors: Laurence Hoffmann, Gerald Bradley, David Sobecki, Michael Price
Question Posted:
