

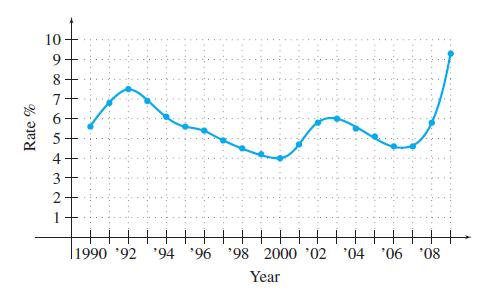
The annual unemployment rates of the U.S. civilian non-institutional population for 19902009 are shown in the graph.
Question:
The annual unemployment rates of the U.S. civilian non-institutional population for 1990–2009 are shown in the graph. Sketch a graph showing the rate of change of the annual unemployment rates for this period. Use the given graph and your sketch to estimate the annual unemployment rate and rate of change of the unemployment rate in 2008.
Fantastic news! We've Found the answer you've been seeking!
Step by Step Answer:
The first graph shows the annual unemployment rates of the US civilian noninstitutional population f...View the full answer

Related Book For 

Calculus With Applications
ISBN: 9780321831101
10th Edition
Authors: Margaret L Lial, Raymond N Greenwell, Nathan P Ritchey
Question Posted:
