

Question: The demand for physicians is expected to increase in the future, as shown in the table on the following page. a. Plot the data, letting
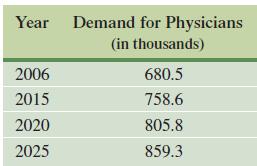
The demand for physicians is expected to increase in the future, as shown in the table on the following page.
a. Plot the data, letting t = 0 correspond to 2000. Does fitting an exponential curve to the data seem reasonable?
b. Use the data for 2006 and 2015 to find a function of the form f(x) = Cekt that goes through these two points.
c. Use your function from part c to predict the demand for physicians in 2020 and 2025. How well do these predictions fit the data?
d. If you have a graphing calculator or computer program with an exponential regression feature, use it to find an exponential function that approximately fits the data. How does this answer compare with the answer to part b?
Year Demand for Physicians (in thousands) 2006 2015 2020 2025 680.5 758.6 805.8 859.3
Step by Step Solution
3.52 Rating (166 Votes )
There are 3 Steps involved in it
here is the data plotted with t 0 corresponding to 2000 An exponential curve does appear to be a rea... View full answer

Get step-by-step solutions from verified subject matter experts