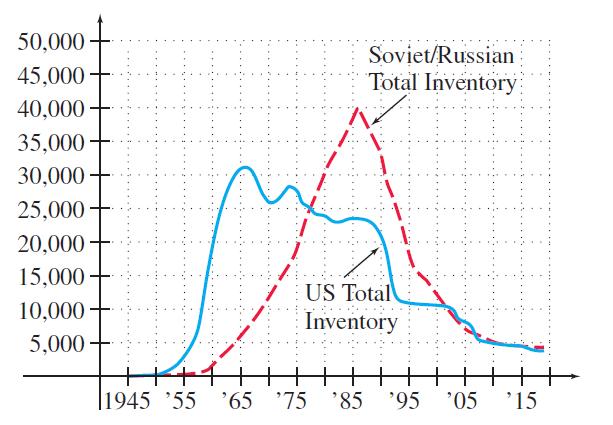
The figure shows estimated totals of nuclear weapons inventory for the United States and the former Soviet
Question:
The figure shows estimated totals of nuclear weapons inventory for the United States and the former Soviet Union (and its successor states) from 1945 to 2019.
(a) On what intervals were the total inventories of both countries increasing?
(b) On what intervals were the total inventories of both countries decreasing?
Fantastic news! We've Found the answer you've been seeking!
Step by Step Answer:
Related Book For 

Question Posted:


