

The following table gives the median age at the first marriage of women in the United States
Question:
The following table gives the median age at the first marriage of women in the United States for some selected years.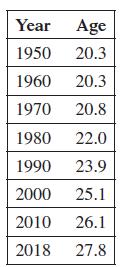
(a) Plot the data using t = 50 for 1950, and so on.
(b) Would a linear or quadratic function best model this data? Explain.
(c) If your graphing calculator has a regression feature, find the quadratic function that best fits the data. Graph this function on the same calculator window as the data.
(d) Find a quadratic function defined by ƒ(t) = a(t - h)2 + k that models the data using 160, 20.32 as the vertex and then choosing (118, 27.8) as a second point to determine the value of a.
(e) Graph the function from part (d) on the same calculator window as the data and function from part (c). Do the graphs of the two functions differ by much?
(f) Use the functions from parts (c) and (d) to predict the median age at their first marriage for women in the United States in 2025.
Step by Step Answer:
a b Quadratic c ft 000111t2 00712t 208 d Given that h k 60 203 the equation ...View the full answer


