

The following table gives the number of families under the poverty level in the U.S. in recent
Question:
The following table gives the number of families under the poverty level in the U.S. in recent years.
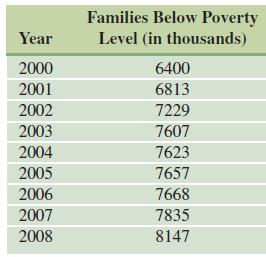
a. Find a linear equation for the number of families below poverty level (in thousands) in terms of , the number of years since 2000, using the data for 2000 and 2008.
b. Repeat part a, using the data for 2004 and 2008.
c. Find the equation of the least squares line using all the data. Then plot the data and the three lines from parts a–c on a graphing calculator.
d. Discuss which of the three lines found in parts a–c best describes the data, as well as to what extent a linear model accurately describes the data.
e. Calculate the correlation coefficient.
Step by Step Answer:
a Find a linear equation for the number of families below the poverty level in thousands in terms of the number of years since 2000 using the data for ...View the full answer


Calculus With Applications
ISBN: 9780321831101
10th Edition
Authors: Margaret L Lial, Raymond N Greenwell, Nathan P Ritchey
