

The following table gives the population of the world at various times over the past two centuries,
Question:
The following table gives the population of the world at various times over the past two centuries, plus projections for this century.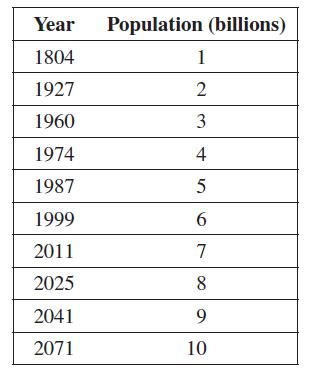
Use a calculator with logistic regression capability to complete the following.
(a) Use the logistic regression function on your calculator to determine the logistic equation that best fits the data.
(b) Plot the logistic function found in part (a) and the original data in the same window. Does the logistic function seem to fit the data from 1927 on? Before 1927?
(c) To get a better fit, subtract 0.99 from each value of the population in the table. (This makes the population in 1804 small, but not 0 or negative.) Find a logistic function that fits the new data.
(d) Plot the logistic function found in part (c) and the modified data in the same window. Does the logistic function now seem to be a better fit than in part (b)?
(e) Based on the results from parts (c) and (d), predict the limiting value of the world’s population as time increases. For comparison, the New York Times article predicts a value of 10.73 billion.
(f) Based on the results from parts (c) and (d), predict the limiting value of the world population as you go further and further back in time. Does that seem reasonable? Explain.
Step by Step Answer:
a A calculator with a logistic regression function determined that best fits the data b From the gra...View the full answer


