

The graph below shows the projected number of people aged 65 and over in the United States
Question:
The graph below shows the projected number of people aged 65 and over in the United States with Alzheimer’s disease. Estimate and interpret the derivative in each of the following years.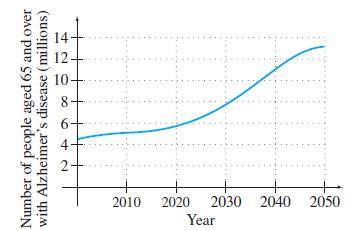
(a) 2000
(b) 2040
(c) Find the average rate of change between 2000 and 2040 in the number of people aged 65 and over in the United States with Alzheimer’s disease.
Fantastic news! We've Found the answer you've been seeking!
Step by Step Answer:
a The slope of the tangent line at x 2000 is about 0...View the full answer

Answered By
Phoebe Arito
I am an all-around finance, grant, audit, and Administration professional.
I am good at my work and time conscious.
I am result oriented person, like meeting deadlines, very neat, problem-solving, a person of integrity, committed, determined and honest.
0 Reviews
10+ Question Solved
Related Book For 

Question Posted:
