

Question: The graph in the next column shows how the risk of chromosomal abnormality in a child rises with the age of the mother. (a) Read
The graph in the next column shows how the risk of chromosomal abnormality in a child rises with the age of the mother.
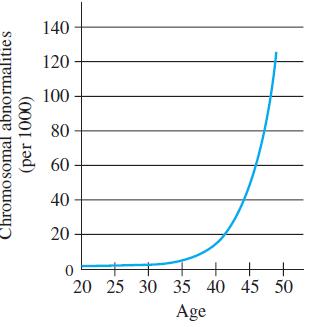
(a) Read from the graph the risk of chromosomal abnormality (per 1000) at ages 20, 35, 42, and 49.
(b) Assuming the graph to be of the form y = Cekt, find k using t = 20 and t = 35.
(c) Still assuming the graph to be of the form y = Cekt, find k using t = 42 and t = 49.
(d) Based on your results from parts (a)–(c), is it reasonable to assume the graph is of the form y = Cekt? Explain.
(e) In situations such as parts (a)–(c), where an exponential function does not fit because different data points give different values for the growth constant k, it is often appropriate to describe the data using an equation of the form y = Cektn. Parts (b) and (c) show that n = 1 results in a smaller constant using the interval [20, 35] than using the interval [42, 49]. Repeat parts (b) and (c) using n = 2, 3, etc., until the interval [20, 35] yields a larger value of k than the interval [42, 49], and then estimate what n should be.
Chromosomal abnormalities (per 1000) 140 120 100 80 60 40 20 0 20 25 30 35 40 45 50 Age
Step by Step Solution
3.43 Rating (166 Votes )
There are 3 Steps involved in it
a From the graph the risks of chromosomal abnormality per ... View full answer

Get step-by-step solutions from verified subject matter experts