

The graph shows annual sales (in thousands of dollars) of a Nintendo game at a particular store.
Question:
The graph shows annual sales (in thousands of dollars) of a Nintendo game at a particular store. Find the average annual rate of change in sales for the following changes in years.
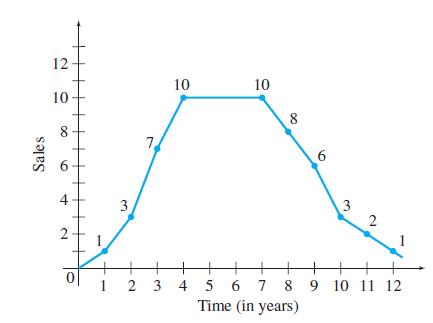
a. 1 to 4
b. 4 to 7
c. 7 to 12
d. What do your answers for parts a–c tell you about the sales of this product?
e. Give an example of another product that might have such a sales curve.
Fantastic news! We've Found the answer you've been seeking!
Step by Step Answer:
To find the average annual rate of change in sales for each period youll need to calculate the diffe...View the full answer

Answered By
Deepak Sharma
0 Reviews
10+ Question Solved
Related Book For 

Calculus With Applications
ISBN: 9780321831101
10th Edition
Authors: Margaret L Lial, Raymond N Greenwell, Nathan P Ritchey
Question Posted:
