

The monthly residential consumption of petroleum (in trillions of BTUs) in the United States for 2019 is
Question:
The monthly residential consumption of petroleum (in trillions of BTUs) in the United States for 2019 is found in the table on the next page.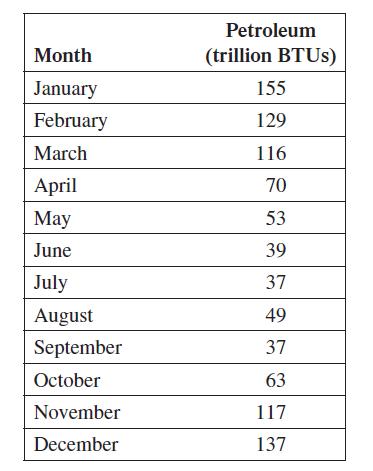
(a) Plot the data, letting t = 1 correspond to January, t = 2 correspond to February, and so on. Is it reasonable to assume that petroleum consumption is periodic?
(b) Use a calculator with trigonometric regression to find a trigonometric function of the form C(t) = a sin(bt + c) + d that models these data when t is the month and C(t) is the amount of petroleum consumed (in trillions of BTUs). Graph this function on the same calculator window as the data.
(c) Estimate the consumption for the month of April and compare it to the actual value.
(d) Estimate the rate at which the consumption is changing in April.
(e) Estimate the total petroleum consumption for the year for residential customers and compare it to the actual value.
(f) What would you expect the period of a function that models annual petroleum consumption to be? What is the period of the function found in part (b)? Discuss possible reasons for the discrepancy in the values.
Step by Step Answer:
a It is not clear whether petroleum consumption is likely t...View the full answer


