

The number of deaths in the United States caused by assault (murder) for each age group is
Question:
The number of deaths in the United States caused by assault (murder) for each age group is given in the table on the next page.
(a) Plot the data. What type of function appears to best match these data?
(b) Use the regression feature on your graphing calculator to find a quartic equation that models the number of years, t, since birth and the number of deaths caused by assault, N(t). Use the midpoint value to estimate the point in each interval when the person died. Graph the function with the plot of the data. Does the function resemble the data?
(c) By finding an appropriate constant k, find a function S(t) = kN(t) that is a probability density function describing the probability of death by assault.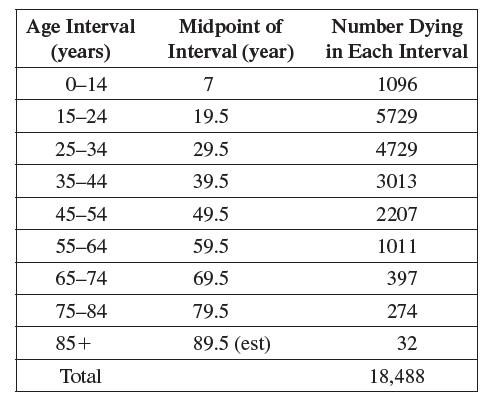
(d) For a randomly chosen person who was killed by assault, find the probabilities that the person killed was less than 25 years old, at least 45 but less than 65 years old, and at least 75 years old, and compare these with the actual probabilities.
(e) Estimate the expected age at which a person will die by assault.
(f) Find the standard deviation of this distribution.
Step by Step Answer:
a A polynomial function could fit the data Your answers to b through f may differ slightly fr...View the full answer


