

Question: The standard normal probability function is used to describe many different populations. Its graph is the well-known normal curve. This function is defined by Give
The standard normal probability function is used to describe many different populations. Its graph is the well-known normal curve. This function is defined by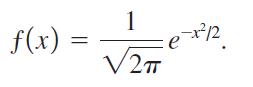
Give the intervals where the function is increasing and decreasing.
f(x) = 1 V2T -xx/2
Step by Step Solution
★★★★★
3.42 Rating (155 Votes )
There are 3 Steps involved in it
1 Expert Approved Answer
Step: 1 Unlock

Choose a value from each of th... View full answer
Question Has Been Solved by an Expert!
Get step-by-step solutions from verified subject matter experts
Step: 2 Unlock
Step: 3 Unlock