

Question: The table below illustrates the dramatic increase in the number of transistors per square mm on computer chips since 1974. (a) To fit the data
The table below illustrates the dramatic increase in the number of transistors per square mm on computer chips since 1974.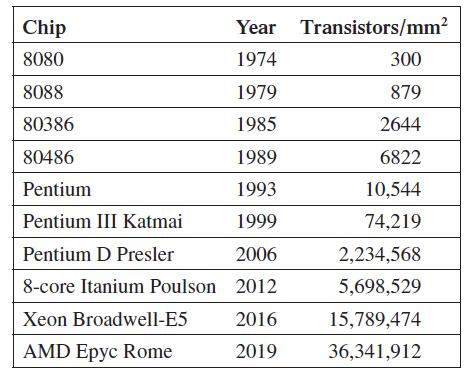
(a) To fit the data to a function of the form y = abt, where t is the number of years since 1970 and y is the number of transistors per mm2, we could take natural logarithms of both sides of the equation to get ln y = ln a + t ln b. We could then let w = ln y, r = ln a, and s = ln b to form w = r + st. Using linear regression, find values for r and s that will fit the data. Then find the function y = abt.
(b) Use the solver capability of a spreadsheet to find a function of the form y = abt that fits the data in the table. 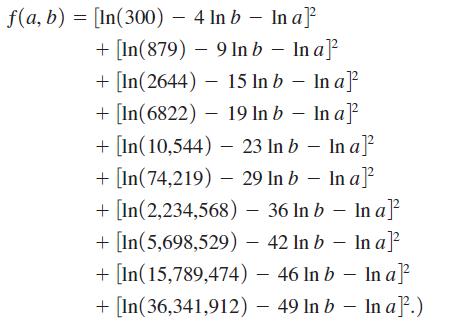
(c) Compare your answer to this problem with the one found with a graphing calculator in the chapter on Nonlinear Functions.
Year Transistors/mm 1974 1979 1985 1989 1993 1999 Chip 8080 8088 80386 80486 Pentium Pentium III Katmai Pentium D Presler 2006 8-core Itanium Poulson 2012 Xeon Broadwell-E5 AMD Epyc Rome 2016 2019 300 879 2644 6822 10,544 74,219 2,234,568 5,698,529 15,789,474 36,341,912
Step by Step Solution
3.49 Rating (149 Votes )
There are 3 Steps involved in it
Using the procedure suggested take the natural logarithm of the numberof... View full answer

Get step-by-step solutions from verified subject matter experts