

The table gives the estimated global carbon dioxide (CO 2 ) emissions from fossil-fuel burning, cement production,
Question:
The table gives the estimated global carbon dioxide (CO2) emissions from fossil-fuel burning, cement production, and gas flaring over the last century. The CO2 estimates are expressed in millions of metric tons.
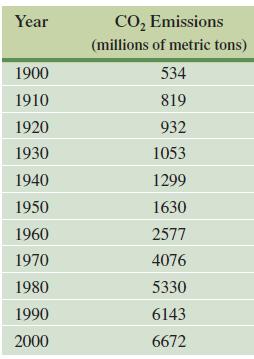
a. Plot the data, letting x = 0 correspond to 1900. Do the emissions appear to grow linearly or exponentially?
b. Find an exponential function in the form of fx = f0ax that fits this data at 1900 and 2000, where x is the number of years since 1900 and f(x) is the CO2 emissions.
c. Approximate the average annual percentage increase in CO2 emissions during this time period.
d. Graph and estimate the first year when emissions will be at least double what they were in 2000.
Step by Step Answer:
a Without the ability to plot the data here you would typically use graphing software to visualize the data points with the years on the xaxis and CO2 ...View the full answer


Calculus With Applications
ISBN: 9780321831101
10th Edition
Authors: Margaret L Lial, Raymond N Greenwell, Nathan P Ritchey
