

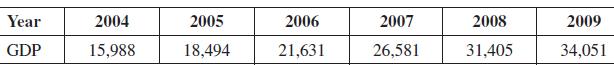
This table lists the gross domestic product (GDP) figures for China (billions of yuan) for the period
Question:
This table lists the gross domestic product (GDP) figures for China (billions of yuan) for the period 2004–2009:
a. Find the least-squares line y = mt + b for these data, where y is the GDP of China t years after 2004.
b. Use the least-squares line found in part (a) to predict the GDP of China for the year 2020.
Fantastic news! We've Found the answer you've been seeking!
Step by Step Answer:
a Let t denote the number of years after 2004 and y the corresponding GDP Then ...View the full answer

Answered By
Bhartendu Goyal
Professional, Experienced, and Expert tutor who will provide speedy and to-the-point solutions. I have been teaching students for 5 years now in different subjects and it's truly been one of the most rewarding experiences of my life. I have also done one-to-one tutoring with 100+ students and help them achieve great subject knowledge. I have expertise in computer subjects like C++, C, Java, and Python programming and other computer Science related fields. Many of my student's parents message me that your lessons improved their children's grades and this is the best only thing you want as a tea...
2+ Reviews
10+ Question Solved
Related Book For 

Calculus For Business, Economics And The Social And Life Sciences
ISBN: 9780073532387
11th Brief Edition
Authors: Laurence Hoffmann, Gerald Bradley, David Sobecki, Michael Price
Question Posted:
