

Question: Using a computer or a graphing calculator, sketch the function for air pollution given in Exercise 86 over the interval [0, 6]. Exercise 86 The
Using a computer or a graphing calculator, sketch the function for air pollution given in Exercise 86 over the interval [0, 6].
Exercise 86
The amount of pollution in the air fluctuates with the seasons. It is lower after heavy spring rains and higher after periods of little rain. In addition to this seasonal fluctuation, the long-term trend in many areas is upward. An idealized graph of this situation is shown in the figure below. Trigonometric functions can be used to describe the fluctuating part of the pollution levels. Powers of the number e can be used to show the long-term growth. In fact, the pollution level in a certain area might be given by P(t) = 7(1 - cos 2πt)(t + 10) + 100e0.2t, where t is time in years, with t = 0 representing January 1 of the base year. Thus, July 1 of the same year would be represented by t = 0.5, while October 1 of the following year would be represented by t = 1.75. Find the pollution levels on the following dates.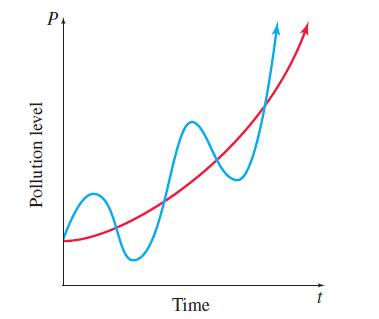
Pollution level P Time
Step by Step Solution
3.43 Rating (159 Votes )
There are 3 Steps involved in it
Pt 71o... View full answer

Get step-by-step solutions from verified subject matter experts