

Water is poured at a constant rate into the vase shown in the accompanying figure. Let h(t)
Question:
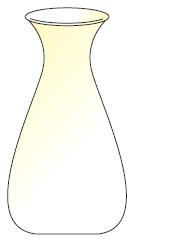
Water is poured at a constant rate into the vase shown in the accompanying figure. Let h(t) be the height of the water in the vase at time t (assume the vase is empty when t = 0). Sketch a rough graph of the function h(t). In particular, what happens when the water level reaches the neck of the vase?
Fantastic news! We've Found the answer you've been seeking!
Step by Step Answer:
The height of th...View the full answer

Answered By
David Muchemi
I am a professional academic writer with considerable experience in writing business and economic related papers. I have been writing for my clients who reach out to me personally after being recommended to me by satisfied clients.
I have the English language prowess, no grammatical and spelling errors can be found in my work. I double-check for such mistakes before submitting my papers.
I deliver finished work within the stipulated time and without fail. I am a good researcher on any topic especially those perceived to be tough.
I am ready to work on your papers and ensure you receive the highest quality you are looking for. Please hire me to offer my readily available quality service.
Best regards,
27+ Reviews
61+ Question Solved
Related Book For 

Calculus For Business, Economics And The Social And Life Sciences
ISBN: 9780073532387
11th Brief Edition
Authors: Laurence Hoffmann, Gerald Bradley, David Sobecki, Michael Price
Question Posted:
