

a. A school carries out a survey to find out how many siblings the students have. Some
Question:
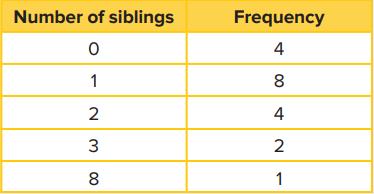
a. A school carries out a survey to find out how many siblings the students have. Some students are chosen and the results are shown in the frequency table.
Calculate the mean, median, mode and range of the number of siblings for the class.
The mean number of siblings is:
![]()
There are four students with no siblings, eight students with one sibling, four students with two siblings etc. So the total number of siblings is:
(4×0)+(8×1)+(4×2)+(2×3)+(1×8)=30
The total number of students is the sum of the frequencies, 19.
The mean = 30/19 = 1.58 (2 d.p.)
Therefore, the mean number of siblings per student is 1.58.
The mode is the number of siblings with the highest frequency. So the modal number of siblings is 1.
The median could be calculated by arranging all 19 students in order of the number of siblings they have as shown:
![]()
As there are 19 students the median value belongs to the 10th student, i.e. 1.
So the median number of siblings is also 1.
However, having to write out all the values in order is not very efficient, particularly if the data set is very large. As the numbers are already written in order in the table, the median can be calculated directly.
We know that as there are 19 students, the middle student occurs in the 10th position. As there are four students with 0 siblings and 8 students with one sibling, making a total of 12 students, the 10th student must be in the group with 1 sibling. Therefore the median is 1.
The range is the difference between the highest number of siblings and the smallest number of siblings.
The highest number of siblings is 8.
The smallest number of siblings is 0.
Therefore the range is 8 – 0=8 siblings.
b. The school has a total of 475 students. Can the total number of students with one sibling be estimated from the sample?
In this case, we are not told how the sample of 19 students used in the survey are selected.
If the 19 students were randomly selected and are therefore representative of the school, then the number of students with 1 sibling can be estimated using 475÷19=25. Therefore the sample is 1/25th of the school population.
An estimate of the number of students with 1 sibling is therefore 25×8=200.
However, the sample may not have been randomly selected and if this is the case, then it is not possible to estimate the total number of students in the school with one sibling based on this sample.
Step by Step Answer:
a The mean number of siblings is calculated by dividing the total number of siblings by the total nu...View the full answer


Cambridge Checkpoint Lower Secondary Mathematics Student's Book 7
ISBN: 9781398301948
3rd Edition
Authors: Frankie Pimentel, Ric Pimentel, Terry Wall
