

The population P (in thousands) of a new town is modelled by the relationship P = ka
Question:
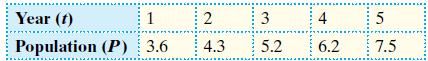
The population P (in thousands) of a new town is modelled by the relationship P = kat where t is the time in years. Its growth over the first five years is shown in the table below.
a. Explain why you would expect that the graph of ln P against t to be a straight line.
b. Draw up a table of values, plot the graph and use it to estimate values for a and k to 1 d.p.
c. Using these values, calculate an estimate for the population after 20 years. How accurate is this likely to be?
Fantastic news! We've Found the answer you've been seeking!
Step by Step Answer:
a The graph of ln P against t is expected to be a straight line because of the given relationship P ...View the full answer

Answered By
Akash M Rathod
I have been utilized by educators and students alike to provide individualized assistance with everything from grammar and vocabulary to complex problem-solving in various academic subjects. I can provide explanations, examples, and practice exercises tailored to each student's individual needs, helping them to grasp difficult concepts and improve their skills.
My tutoring sessions are interactive and engaging, utilizing a variety of tools and resources to keep learners motivated and focused. Whether a student needs help with homework, test preparation, or simply wants to improve their skills in a particular subject area, I am equipped to provide the support and guidance they need to succeed.
0 Reviews
10+ Question Solved
Related Book For 

Cambridge IGCSE And O Level Additional Mathematics
ISBN: 9781510421646
1st Edition
Authors: Val Hanrahan, Jeanette Powell
Question Posted:
