

The table below shows the area, A, in square centimetres of a patch of mould t days
Question:
The table below shows the area, A, in square centimetres of a patch of mould t days after it first appears.
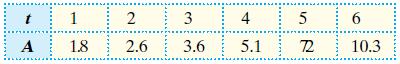
It is thought that the relationship between A and t is of the form A = kbt.
a. Show that the model can be written as logA = (logb)t + logk.
b. Plot the graph of logA against t and explain why it supports the assumption that A = kbt.
c. Use your graph to estimate the values of b and k.
d. Estimate:
i. The time when the area of the mould was 6 cm2
ii. The area of the mould after 4.5 days.
Fantastic news! We've Found the answer you've been seeking!
Step by Step Answer:
a Taking the logarithm of both sides of A kbt we get log A log kbt Using the rule of logarithms that ...View the full answer

Answered By
Darwin Romero
I use a hands-on technique and am approachable to my students. I incorporate fun into my lessons when possible. And while my easy-going style is suitable for many subjects and grades, I am also able to adapt my style to the needs of the student. I can describe myself as friendly, enthusiastic and respectful. As a teacher, we can easily get respect from the students if they would feel respected first
0 Reviews
10+ Question Solved
Related Book For 

Cambridge IGCSE And O Level Additional Mathematics
ISBN: 9781510421646
1st Edition
Authors: Val Hanrahan, Jeanette Powell
Question Posted:
