

The following graph shows the routes connecting buildings on a university campus. The numbers represent the time
Question:
The following graph shows the routes connecting buildings on a university campus. The numbers represent the time taken (in minutes) to cycle from one building to another.
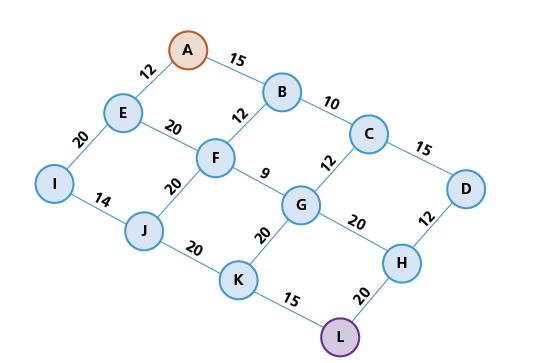
a) i) Use Dijkstra’s algorithm to find the minimum time to cycle from building A to building L.
ii) Write down the corresponding shortest route.
b) It has been decided to construct a new cycle path, either from A directly to D (cycle time 30 minutes) or from A directly to I (cycle time 20 minutes).
Identify the option that would reduce the cycle time from building A to building L by the greatest amount.
Fantastic news! We've Found the answer you've been seeking!
Step by Step Answer:
a i Using Dijkstras algorithm the minimum time to cycle from buildi...View the full answer

Answered By
James Warinda
Hi! I’m James Otieno and I'm an experienced professional online tutor with countless hours of success in tutoring many subjects in different disciplines. Specifically, I have handled general management and general business as a tutor in Chegg, Help in Homework and Trans tutor accounts.
I believe that my experience has made me the perfect tutor for students of all ages, so I'm confident I can help you too with finding the solution to your problems. In addition, my approach is compatible with most educational methods and philosophies which means it will be easy for you to find a way in which we can work on things together. In addition, my long experience in the educational field has allowed me to develop a unique approach that is both productive and enjoyable.
I have tutored in course hero for quite some time and was among the top tutors awarded having high helpful rates and reviews. In addition, I have also been lucky enough to be nominated a finalist for the 2nd annual course hero award and the best tutor of the month in may 2022.
I will make sure that any student of yours will have an amazing time at learning with me, because I really care about helping people achieve their goals so if you don't have any worries or concerns whatsoever you should place your trust on me and let me help you get every single thing that you're looking for and more.
In my experience, I have observed that students tend to reach their potential in academics very easily when they are tutored by someone who is extremely dedicated to their academic career not just as a businessman but as a human being in general.
I have successfully tutored many students from different grades and from all sorts of backgrounds, so I'm confident I can help anyone find the solution to their problems and achieve
0 Reviews
10+ Question Solved
Related Book For 
Cambridge International AS & A Level Computer Science
ISBN: 9781510457591
1st Edition
Authors: David Watson, Helen Williams
Question Posted:
