

a. Find the range and the interquartile range of the dataset represented in the following box plot.
Question:
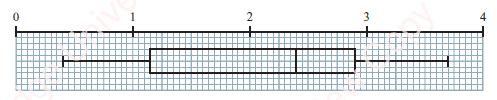
a. Find the range and the interquartile range of the dataset represented in the following box plot.
b. What type of skewness would you expect this set of data to have?
Fantastic news! We've Found the answer you've been seeking!
Step by Step Answer:
a From the box plot Minimum value Q0 is obtained as If 20 smallsquared boxes represent 1 unit Then 8 ...View the full answer

Answered By
Bhartendu Goyal
Professional, Experienced, and Expert tutor who will provide speedy and to-the-point solutions. I have been teaching students for 5 years now in different subjects and it's truly been one of the most rewarding experiences of my life. I have also done one-to-one tutoring with 100+ students and help them achieve great subject knowledge. I have expertise in computer subjects like C++, C, Java, and Python programming and other computer Science related fields. Many of my student's parents message me that your lessons improved their children's grades and this is the best only thing you want as a tea...
2+ Reviews
10+ Question Solved
Related Book For 

Cambridge International AS & A Level Mathematics Probability & Statistics 1 Coursebook
ISBN: 9781108407304
1st Edition
Authors: Dean Chalmers, Julian Gilbey
Question Posted:
