

The diagram shows part of the curve y = 2 x 2 ln(x + 1). The
Question:
The diagram shows part of the curve y = 2 − x2 ln(x + 1). The shaded region R is bounded by the curve and by the lines x = 0, x = 1 and y = 0. Use the trapezium rule with intervals to estimate the area of R giving your correct to 2 decimal places. State, with a reason, whether the trapezium rule gives an under-estimate or an over-estimate of the true value of the area of R.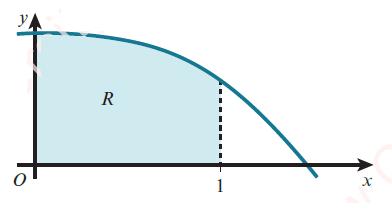
Fantastic news! We've Found the answer you've been seeking!
Step by Step Answer:
Since we are using the trapezium rule with 4 intervals we will divide the interval 01 ...View the full answer

Answered By
Krishnavendra Y
I am a self motivated financial professional knowledgeable in; preparation of financial reports, reconciling and managing accounts, maintaining cash flows, budgets, among other financial reports. I possess strong analytical skills with high attention to detail and accuracy. I am able to act quickly and effectively when dealing with challenging situations. I have the ability to form positive relationships with colleagues and I believe that team work is great key to performance. I always deliver quality, detailed, original (0% plagiarism), well-researched and critically analyzed papers.
4+ Reviews
10+ Question Solved
Related Book For 

Cambridge International AS & A Level Mathematics Pure Mathematics 2 & 3 Coursebook
ISBN: 9781108407199
1st Edition
Authors: Sue Pemberton, Julianne Hughes, Julian Gilbey
Question Posted:
